Top Selling Energy Drink Brands

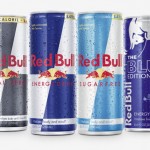
Red Bull continues to dominate as the energy drink leader, but Monster has experienced huge growth in the last few years.
The energy drink market continues to grow even in light of the tough economy and increased health scrutiny. Soda sales have been declining steadily over the same period, while energy drink sales have been booming.
Despite recent FDA scrutiny regarding the safety of these beverages, 2013 energy drink sales are up 6.7% over last year in the USA alone. src.
Did your favorite energy drink make the list?
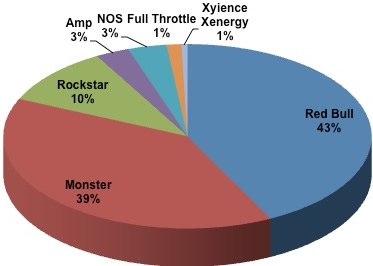
Energy Drink Brand Market Share 2014
USA Top Selling Energy Drink Brands
| Rank | 2015 | 2015 sales ($millions) |
2014 | 2014 sales ($millions) | 2013 | 2013 sales ($millions) | 2012 | 2012 sales ($millions) | 2011 | 2011 sales ($millions) | 2010 | 2010 sales ($millions) | 2008 | 2008 sales (%share) | 2007 | 2007 sales (%share) | 2006 | 2006 sales (%share) |
|---|---|---|---|---|---|---|---|---|---|---|---|---|---|---|---|---|---|---|
| 1 | Red Bull | 4,550 | Red Bull | 2,883 | Red Bull | 3,433 | Red Bull | 2,950 | Red Bull | 2,300 | Red Bull | 2,200 | Red Bull | 40% | Red Bull | 35.2% | Red Bull | 42.6% |
| 2 | Monster | 3,690 | Monster | 2,476 | Monster | 3,147 | Monster | 2,600 | Monster | 1,900 | Monster | 1,500 | Monster | 23% | Monster | 27.3% | Monster | 14.4% |
| 3 | Rockstar | 820 | Rockstar | 647 | Rockstar | 821 | Rockstar | 780 | Rockstar | 660 | Rockstar | 400 | Rockstar | 12.3% | Rockstar | 11.1% | Rockstar | 11.4% |
| 4 | NOS | 542 | NOS | 294 | NOS | 274 | Amp | 300 | Amp | 330 | NOS | 200 | Amp | 8% | Full Throttle | 6.6% | Full Throttle | 6.9% |
| 5 | Amp | 146 | Amp | 212 | Amp | 239 | NOS | 250 | Doubleshot | 250 | Doubleshot | 180 | Full Throttle | 4% | Amp | 5.1% | Sobe No Fear | 5.4% |
| 6 | Full Throttle | 143 | Full Throttle | 114 | Full Throttle | 104 | Full Throttle | 140 | NOS | 220 | Amp | 140 | Doubleshot | 2% | No Fear | 2.7% | Amp | 3.6% |
| 7 | Xyience Xenergy | 40 | Xyience Xenergy | 43 | Xyience Xenergy | 40 | Full Throttle | 130 | Full Throttle | 110 | NOS | 1.5% | NOS | 2.1% | Sobe Adrenaline Rush | 2.9% | ||
| 8 | Arizona Energy | 28 | VPX Redline | – | VPX Redline | 15 | Xyience Xenergy | 30 | – | – | No Fear | 1.4% | Adrenaline | 2.1% | Tab Energy | 2.3% | ||
| 9 | Rip It | 22 | ||||||||||||||||
| 10 | Venom | 19 |
Scroll right to see earlier years.
* Although the energy drink market grew in 2014 with all the major brands showing increased sales as well, the data above doesn’t reflect this. This is due to IRI² not having access to certain retailers’ sales data. Pre-2013 data does not include Walmart sales so most numbers would be higher with that factored in. 2009 sales data is unavailable.
The top Monster drinks are: Monster Energy, Java Monster, Monster Mega Energy, and Monster Rehab.
In case you didn’t read that correctly: Red Bull sold US$3.4 BILLION dollars of energy drink product in the 52 weeks prior to July 2013. Monster sold US$3.1 BILLION worth.
A huge part of energy drink popularity is in the sponsorship efforts, with top brands spending large sums of money to achieve brand placement. Xyience has definitely been lifting their marketing efforts and it’s paying off with their recent entrance into the top 15 energy drinks ranking.
That’s fine for the USA, but many have been wanting some data for the worldwide energy drink market.
Good news! We finally were able to track down some numbers.
Worldwide Top 15 Energy Drinks
Based on worldwide sales figures here’s how the energy drink brands stack up worldwide.
| Rank | 2015 | 2015 sales ($millions) |
|---|---|---|
| 1 | Red Bull | 12,463 |
| 2 | Monster | 4,773 |
| 3 | Rockstar | 1,085 |
| 4 | Lucozade | 709 |
| 5 | NOS | 542 |
| 6 | Burn | 472 |
| 7 | M-150 | 325 |
| 8 | Sting | 261 |
| 9 | Cobra | 260 |
| 10 | Hi-Tiger | 224 |
| 11 | Eastroc Super Drink | 213 |
| 12 | Adrenaline Rush | 177 |
| 12 | Dekavita C | 174 |
| 13 | Power Horse | 173 |
| 14 | Relentless | 159 |
| 15 | Amp | 155 |
The data for the above graph was provided to us by Euromonitor International who tracks the worldwide sales of energy drinks and many other consumer products.
Red Bull has a sizable lead in the USA, but worldwide the energy drink giant has a massive lead over any other competitor.
Top Selling Energy Shot Brands
| Rank | 2015 | 2015 sales ($millions) |
2014 | 2014 sales ($millions) | 2013 | 2013 sales ($millions) | 2012 | 2012 sales ($millions) | 2011 | 2011 sales ($millions) |
|---|---|---|---|---|---|---|---|---|---|---|
| 1 | 5 Hour Energy | 725 | 5 Hour Energy | 732 | 5 Hour Energy | 1,114 | 5 Hour Energy | 896 | 5 Hour Energy | 996 |
| 2 | Stacker inc/6 hr. Power | 10 | Stacker inc/6 hr. Power | 11 | Stacker inc/6 Hour Power | 47 | 6 Hour Power | 30 | 6 Hour Power | 22 |
| 3 | Tweaker | 8.3 | Tweaker | 8 | Private Label | 17 | Red Bull Shot | 25 | Worx | 14 |
| 4 | RhinoRush | 3.7 | Street King | 3.7 | Worx Energy Shot | 7 | Monster Hitman | 10 | E6 | 5 |
| 5 | Vital 4 U | 3.5 | Vital 4 U | 3.4 | Tweaker | 5 | Stacker 2 | 4 | Stacker 2 | 4 |
| 6 | Fuel In A Bottle | 3.3 | Fuel In A Bottle | 3 | Street King | 4.9 | Nitro 2 Go | 3.4 | Redline Power Rush | 3.5 |
| 7 | Street King | 3 | RhinoRush | 2.9 | E6 Energy Shot | 3.9 | Redline | 3.2 | Spike Double Shot | 3.2 |
| 8 | E6 Energy Shot | 2.5 | Nitro 2 Go | 2.68 | Rip It Energy Shot | 3.2 | Vital 4U | 3.1 | Vital 4U | 3 |
| 9 | Rip It Shot | 1.7 | E6 Energy Shot | 2.65 | ||||||
| 10 | Nitro 2 Go | 1.4 | Worx Energy Shot | 1.3 |
5 Hour Energy certainly has the energy shot market cornered with none of the others anywhere in the same universe as 5 Hour, but they seem to be losing their dominance in late 2014 as other brands gain market share. The energy shot market segment was down 4.1% in 2014 compared to the same time period the previous year and in 2015 down again. It looks like some are losing their enthusiasm for the energy shot. ²
Top Selling Energy Drink Mixes
| Rank | 2013 | 2013 sales ($millions) |
|---|---|---|
| 1 | MIO Energy | 55 |
| 2 | Crystal Light Energy | 39.5 |
| 3 | Private Label | 36.7 |
| 4 | Propel Energy Drink Mix | 23 |
| 5 | Zipfizz | 12.5 |
| 6 | 4C Energy Rush | 3.3 |
| 7 | Ecodrink | 1.5 |
| 8 | Splash | .34 |
Which Companies Own Which Brands?
It’s also interesting to note that some parent companies own several different brands of energy drinks. Here’s a bit of the breakdown.
- Coca Cola owns Nos, Burn, and Relentless but has given Monster Energy the rights to these brands.
- Pepsi Co. owns Amp, Starbucks bottled drinks, Mountain Dew Kickstart but sold No Fear.
- Monster also owns Worx Energy Shot.
- Coca-Cola just bought a 17% Stake in the Monster Beverage Company. Monster will take over Coke’s Energy Drink Brands and Coke takes over Monster’s Hanson brand.
- Rockstar is still flying solo, but is distributed by Pepsi.
Does top selling mean that they are also the best energy drinks?
Get Help Quitting Caffeine
Reduce your caffeine intake without pain and discomfort.
Download our FREE ebookReferences
- 1. 2013 Data is from the top brands per, latest 52 week period, Total U.S. Multi-Outlet w/ C-Store (Supermarkets, Drugstores, Mass Market Retailers, Gas/C-Stores, Military Commissaries and Select Club & Dollar Retail Chains) provided by "IRI, a Chicago-based market research firm (@iriworldwide)".
- 2. 2014 and 2015 Data is from IRI covering a 52 week period ending November 2, 2014 and March 22, 2015; based on USA sales only and some retailers not reporting.
- 3. Prior to 2013 the data was compiled from data published by beverage industry insider Bevnet.com